Showing the Application Programming Interface
If that worked, you will now see the debugger.
(If it didn't open up, all I can suggest is that you retrace your steps through these notes.)
(More information on the debugger can be found here http://qt.developpez.com/doc/4.7/qtscriptdebugger-manual/
And in a video here http://www.youtube.com/watch?v=pyUKtOV9qn8.)
To see the whole object tree,
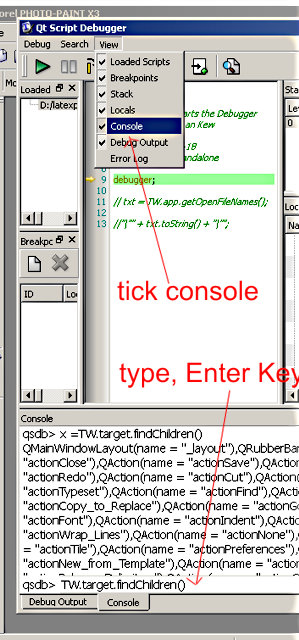
Run this in the Qt Script Debugger Console prompt as shown below:
qsdb> x =TW.target.findChildren();
And then look for "x" in the "Locals" pane in the debugger.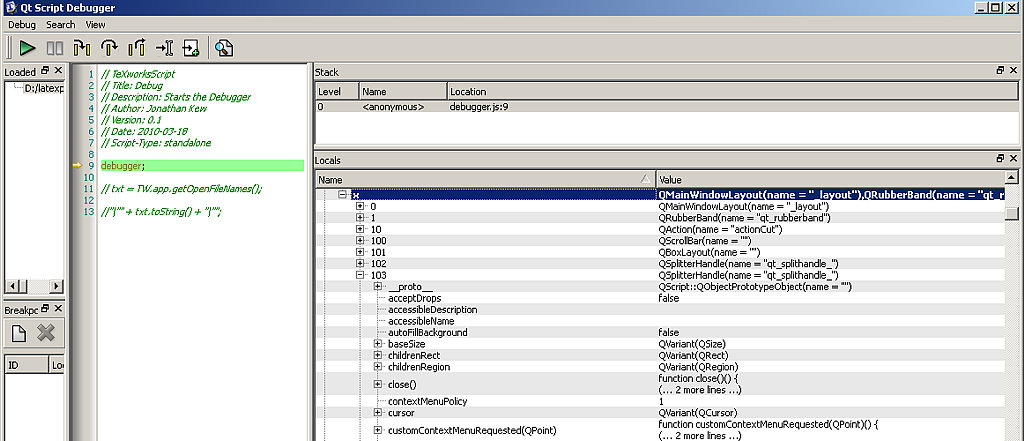
Only focus on things immediately below "x" that have a
"name="Something" for if it has no name. you probably will not find a
way of reliably addressing / accessing it.
You'll be able to read any of the actually used/available properties
and functions. You can check their details in the Qt objects functions
and properties on the Qt web site
In the Locals panel in the debugger. take note of the QtSomething name like:
QSplitterHandle(name = "qt_splithandle_") in the image above for item 103.
QSplitterHandle is what you would search for in the Qt documentation.
Keep an eye on Qt version number, 4.4 is probably safe for general use
according to postings here, but if you know that your version of your
Tw release was built on a higher number of Qt, use that version's
documentation (check Tw's Help/About dialogue - for example my help
about says thta Tw 0.3 ver649 was built using Qt 4.6).
The higher Qt versions do introduce more functionality - but standard
Tw releases and distributions may, as of November 2010, only use 4.4.,
although as of February 2011 4.7.1 is still being used.
http://doc.trolltech.com/4.4/qtscript.html
On the web page use the menu at top once you've read a bit about
scripting and how it relates to this sort of tree ("x").
Created with the Personal Edition of HelpNDoc: Single source CHM, PDF, DOC and HTML Help creation